Your cart is currently empty!
Resource Details
Protein Identification by Mass Spectrometry: How does it work?
by Jean-Philippe Couture, PhD, Scientific Sales Manager
How to identify an unknown protein by mass spectrometry
We’ve all been there. The research is going great, the results are coming in and a picture of how everything works together is starting to emerge. Then, you hit that wall: an annoying unknown protein sitting in the middle of the model.
The project has gone smoothly, except for this question mark. And now, your PI asks you to identify that missing player to resolve the mystery. So, you go on Google or PubMed and start looking for ways to identify unknown proteins. The answer to your query is clear: you need mass spectrometry.
But you don’t know how it works and you will have to explain it in the next lab meeting.
Don’t worry, we can help.
In this blog post, we explain the processes behind protein identification by LC-MS/MS. We’ll describe how you should prepare your sample, how the machine works, how a program can identify proteins, and even share our optimized protocol for in-gel protein identification. You will be on your way to identifying the unknown protein in no time.
How to prepare your sample for protein identification by mass spec
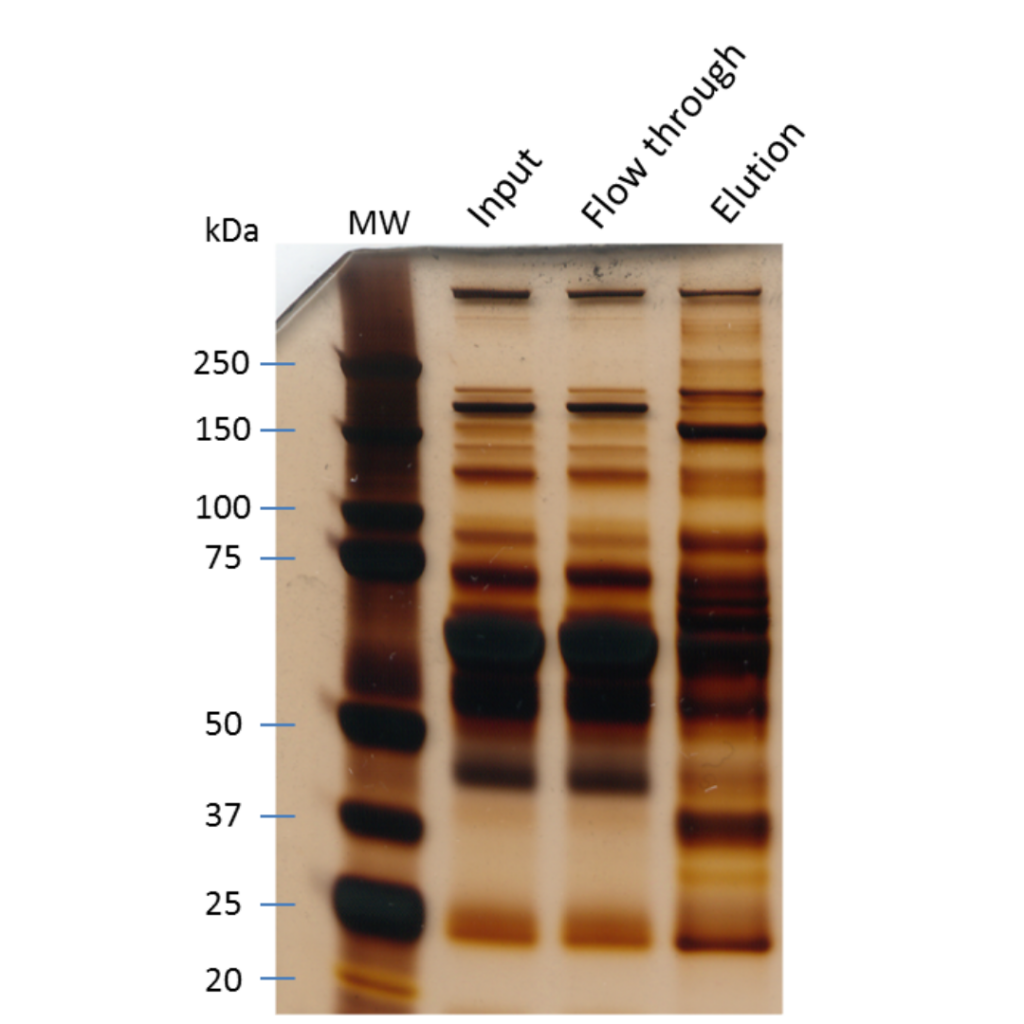
This really depends on how you found out you had a protein to identify. Did you purify your protein of interest and found another protein eluting from the preparation? Or did you do an immunoprecipitation of your target protein and dye the SDS PAGE gel to find a major band besides your bait?
In all cases, you will want to redo the protocol with clean material to limit the contamination of your sample by keratins.
Those pesky proteins are present everywhere and can really hinder the identification of your protein if they are too concentrated in your sample.
Since we will focus on the identification of a protein from a gel, we suggest you take a look at our protocol for the identification of a protein from a Coomassie Blue-stained gel for an example of the experimentation itself. As stated in our post on sample preparation, you should always be working with gloves, filtered pipette tips, and low-binding Eppendorf tubes. This will greatly enhance the peptide recovery and the success of your experiment. Whatever sample preparation method you use, you must keep in mind that with mass spectrometry, you should always work in a clean environment and with appropriate tools.
As you know, proteins are in fact a chain of amino acids that are covalently linked to one another. In order to identify your protein by LC-MS/MS, you will have to break it in to smaller parts, called peptides. This is usually done by enzymatic digestion with proteolytic enzymes, such as trypsin or chymotrypsin. The choice of which enzyme to use is determined by the sequence of your protein of interest.
In the case of an unknown protein, we usually choose trypsin because of its low miscleavage rate and its high activity in rather denaturing buffers. Again, the protocol for enzymatic digestion will vary according to the matrix in which your protein is. If it is in a buffer in a relatively pure state (from a HPLC purification, for example), chances are you could just add the enzyme and proceed to the digestion. If your protein is in a gel, the procedure may be a bit more complex. The end results should however always be the same: a clean peptide mixture that you can analyze by LC-MS/MS.
Download your protocol here
LC-MS/MS data acquisition
Now that you have your peptide mixture, you are ready to ship it for analysis to your favorite mass spectrometry service provider. There are several different acquisition modes that you can use to identify proteins, but we will focus on the information dependant acquisition (IDA, also known as data dependent acquisition, or DDA) in this post. IDA uses the very high speed and resolution of the mass spectrometer to determine the mass of the peptides that are in your sample. Here’s how it works:
2.1 – Chromatographic separation (LC):
The peptide mixture is loaded on a chromatographic column. Peptides with different amino acid composition will have different affinities with the column. By applying liquid phases with an increasing concentration of organic solvent over time to the column, we can separate the peptides from one another. According to their affinity for the column, the peptides will be gradually released from the column by the increasing organic concentration in the mobile phase and will gradually enter the mass spectrometer. The chromatographic separation enables the peptides to be concentrated at one point in time and facilitates their detection by the machine. On average, on a micro-LC with a 60-minute gradient, it takes approximately 45 seconds for all the copies of a peptide to elute from the column.
2.2 – Mass spectrometry analysis:
In mass spectrometry, the term “cycle” represents the sum of all the small tasks that are done by the machine. For example, in the IDA mode, a cycle includes a survey scan and several product ion scans (up to 40 for high resolution mass spectrometers). Each of the components of a cycle takes a small amount of time to be completed. For example, if a cycle has a 200-millisecond survey scan and 40 product ion scans each lasting 35 milliseconds, the total time the machine takes to complete a cycle is roughly 1.6 seconds (200ms + (40 x 35ms) = 1600 ms). Once a cycle has been completed, the machine starts a new cycle. This goes on for the whole length of the analysis. During a 60-minute gradient, the mass spec will complete approximately 2118 cycles. No wonder an MS analysis produces so much data! Here is the description of the two main scan types that are required in an IDA mode analysis.
Survey scan (once at the start of the cycle):To identify proteins with the IDA mode, the MS first performs a full reading of the flow of ions that is called a survey scan. The survey scan records the mass over charge ratio (m/z) of every ion that is entering the machine at this time. The scan lasts for about 200 milliseconds. At the end of the scan, the machine knows which ions were present in the sample at this time point and can rank them by signal intensity.
Product ion scan (repeated multiple times):The second part of the IDA method is known as the product ion scan. During the survey scan, the machine created a list of the x most intense ions (up to 40) in the ion flow entering the machine. The first product ion scan will isolate the first most intense ion, fragment it, and record the m/z ratio of all its fragments. This lasts for approximately 35 milliseconds. Once this is done, the machine runs a second product ion scan. It therefore isolates, fragments, and records the m/z ratio of the fragments of the second most intense ion… and so on until the number of ions to analyze in the cycle is reached (up to 40 in one cycle). Then, the first cycle ends, and second cycle starts. A peptide elutes from the column for approximately 45 seconds in a 60-minute LC gradient. Knowing that a cycle lasts only 1.6 seconds, this means that we could potentially detect the same peptide roughly 28 times during its elution from the column (45 sec/1.6 sec per cycle = 28). Since the machine only records the 40 most intense ions out of several hundred at one time, we could potentially miss a lot of information. This is where a useful exclusion feature of the IDA method comes into play. Indeed, we can tell the machine to record the same ion only two times and to exclude it for a set number seconds afterwards. During the next cycle where this ion is detected in the survey scan after it’s been recorded twice, it will not be counted in the 40 product ion scans. Instead, the machine will isolate and fragment the 40+1th most intense ion. This can continue indefinitely, explaining how the machine can obtain a good sequencing depth, even while being limited to 40 product ion scans per cycle!
Protein identification
The end result of the IDA method is a list of precursor ions (recorded during the survey scan) and of their associated fragments (recorded during the product ion scan). The files produced by the MS are then fed into a program that will perform the identification of the proteins in two steps*.
*We work with ProteinPilot Software (by Sciex) and will cover how this suite of algorithms works for protein identification. Note that there are other tools out there that can do similar analyses, all with slight differences in outputs.
3.1 – Peptide identification:
In ProteinPilot, the algorithm that is in charge of the peptide identification is named Paragon. To identify peptides, this program looks at all the m/z of the product ions to find very short peptide fragments that could correspond to 2-3 amino acids. These small fragments, named taglets, can easily be identified with good confidence because the number of different post-translational modifications that can be found on such a small peptide is limited. To determine their sequence, the program maps the detected m/z of the taglet on the theoretical m/z of all the amino acids, with and without modifications. If the m/z of the taglet is within a small range of a theoretical small peptide sequence, it is considered as identified and receives a good score. However, if the difference between the taglet’s m/z and a theoretical sequence is more important, it will receive a lower score. This process can be visualized on the top part of the Figure 2 below.
Once the amino acid sequence of the taglet is determined, Paragon maps it to all the proteins in the database to determine where this small sequence can be found. After all the taglets have been mapped, the program will attribute a temperature to every region of the proteome based on the density of taglets it contains.
For example, if a region of the proteome contains the sequence of several taglets or taglets with very high scores, it will be identified as hot by the program and will receive more searching power (explained in more details in Figure 2). Conversely, a region that contains only one or no taglet will be flagged as cold. The logic behind this is that if several taglets map to a specific region, it means that the peptides that contain the taglet will also map to that region, which makes it more worthy of a high searching power. Using this strategy allows the algorithm to search more efficiently, since it will dedicate less efforts in cold regions of the proteome, i.e. where less peptides are expected to be found, than in hot regions. Searches with the Paragon algorithm are thus faster than with other algorithms, while maintaining the same efficiency. In summary, the temperature map of the proteome that was generated from the mapping of the taglet to the proteome is used by Paragon to determine the searching power that will be attributed to complete the sequence of each taglet and find the peptide it came from. A very nice video explaining the Paragon algorithm can be found here.
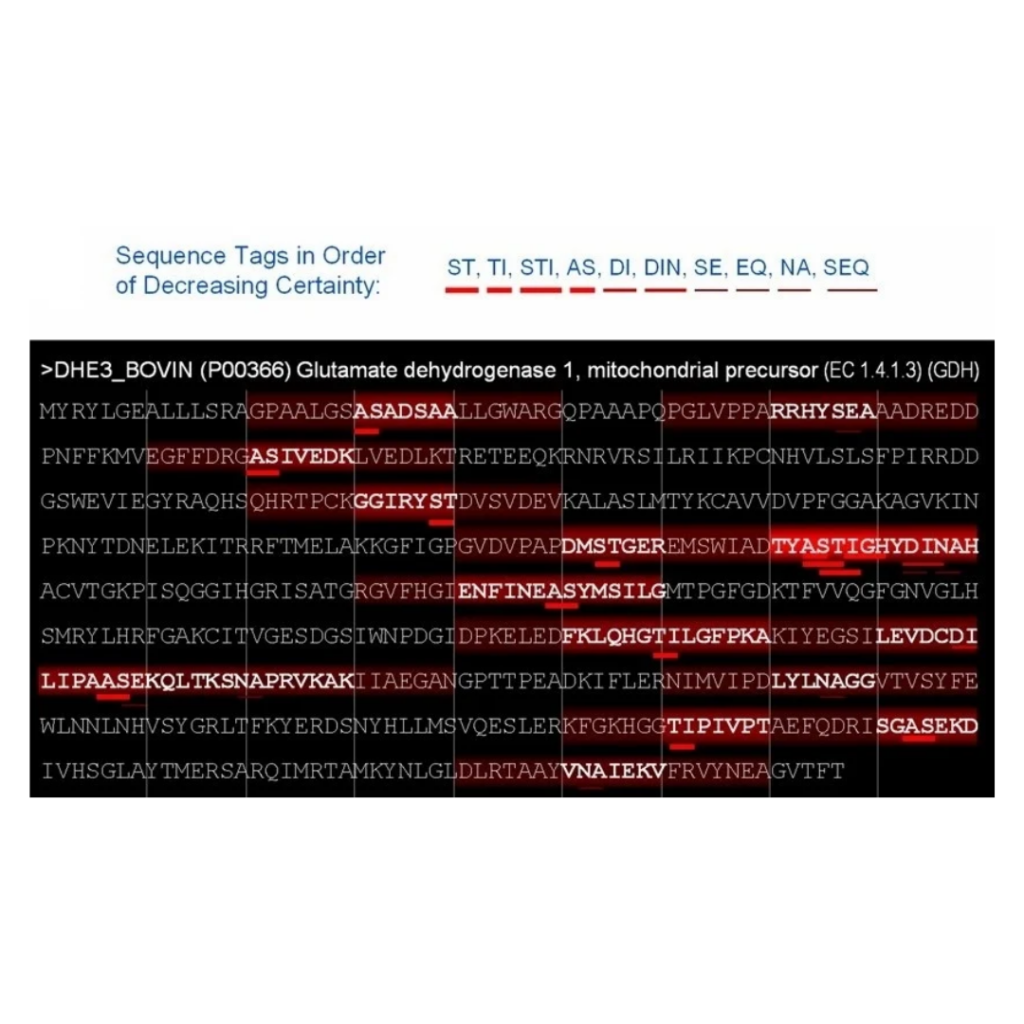
Fig2: Example of a Paragon search.
The different taglets identified by Paragon are listed on the top of the figure. The thicker the red line under the taglet is, the higher score it received. In this example, only one protein is shown. The red lines underneath the sequence indicate the mapping of the taglets on the amino acid sequence of the protein. The more taglet a region has, the “hotter” it is considered by Paragon. Once this process is done, Paragon attributes different search power to the regions, according to their relative “temperature”. If a region is “hot”, Paragon will search more extensively to find peptides for this region. For example, a “hot” region will be searched for all the available post-translational modifications known to date and for a lot of rare miscleavages, whereas a “cold” region will only be searched for the most common PTMs. This figure was taken from the original Paragon paper from Sciex (2007).
3.2- Protein identification:
The algorithm for protein identification from SCIEX is named Pro Group™ Algorithm. The goal of this program is to take the peptides identified by Paragon and to infer the most likely list of proteins explained by this peptide evidence. Although mapping a peptide sequence to a protein may seem simpler than to determine the sequence of the peptides from its fragments, protein identification has core difficulties that the program needs to overcome. For starters, a lot of proteins share conserved regions in their amino acid sequence. Therefore, there are a lot of peptides that could come from more than one protein. Also, some MS/MS spectra cannot be assigned to only one sequence. Thus, there are a lot of uncertainties that need to be considered when determining the list of proteins in a sample. Let’s create an example where a peptide X can be found in 3 different proteins, Prot1, Prot2 and Prot3. When detecting this peptide, the program has no way of knowing, biologically speaking, if the peptide was coming from Prot1, Prot2, Prot3, or any combination of these proteins. Therefore, all the shared peptides, like peptide X, will be associated to only 1 of these proteins, Pept1 for example. So in the protein list that will be generated by the program, we will only find Prot1 (unless a differentiating peptide between Prot1 and Prot2 or Prot3 can be detected, in that case, both proteins will be shown).
What does a protein identification look like?
By following the process we’ve outlined in this post, the unknown band on your gel is now an identified protein. Interestingly, the same MS process can be coupled with other sample preparation techniques, such as immunoprecipitation, to identify protein-protein interaction partners or post-translational modifications on your protein of interest.
The screenshots below illustrate what a protein identification looks like in the ProteinPilot software. It also emphasizes how complex such an analysis is, and how much data can be generated with only one MS experiment!
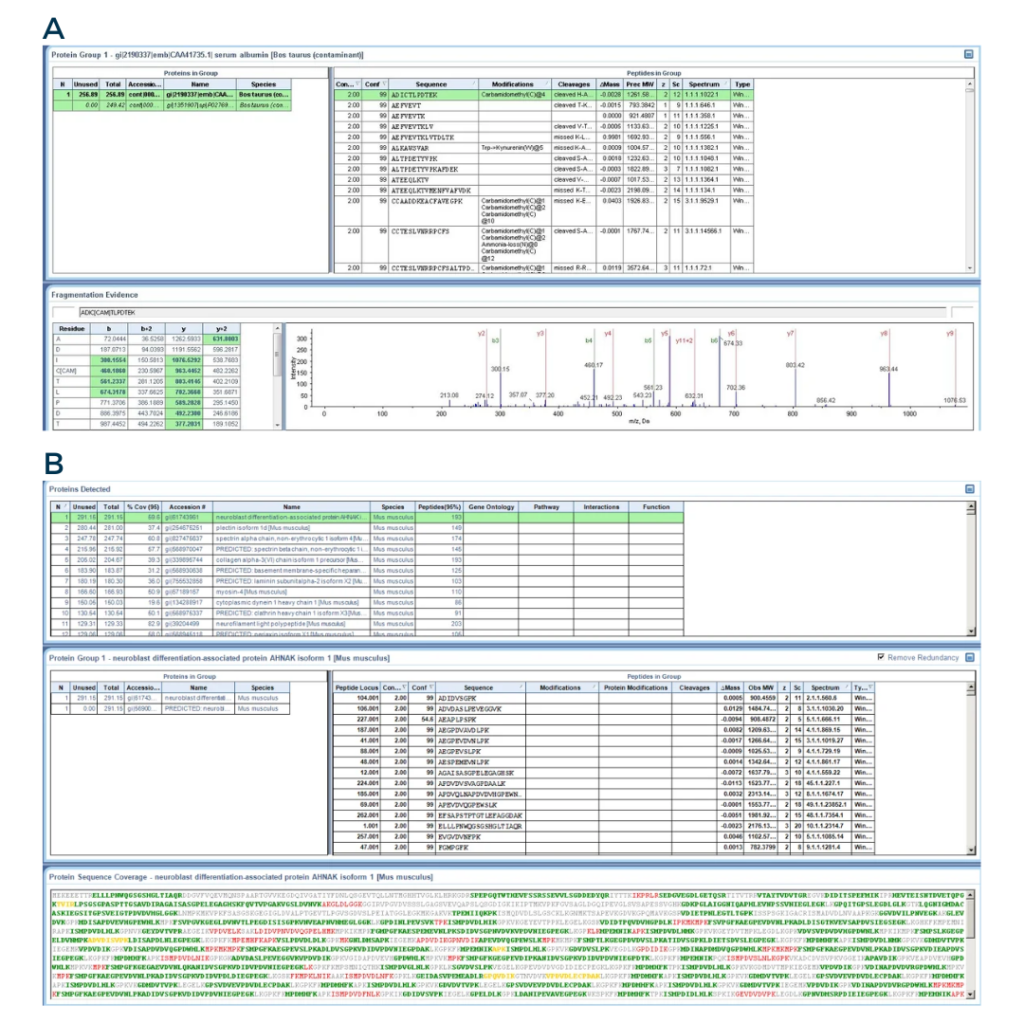
Fig3: From the ProteinPilot software
A) Screenshot of a peptide identification. The bottom right panel displays the MS/MS spectra of one peptide.
B) Screenshot of a protein identification. The lower panel shows the peptides that were detected during the peptide identification. The green letters represents peptides with a good confidence, while the yellow and red letters represents peptides with medium and low confidence, respectively.
Conclusion
Mass spectrometry is a powerful tool to identify proteins from a sample. Whether it is from a very complex sample or from a single protein band cut from a polyacrylamide gel, LC-MS/MS is the most efficient way to get your proteomics project moving forward.
More questions about this blog post or how mass spec can help you in your research?