What should you expect from your proteomics experiments? [SWATH]
Science goes fast, so should you!
Modern science tends to make good use of major advances in technology. The ever increasing number of “omics” studies in high impact factor journals supports this claim. It also shows that, when used to their full potential, the massive data derived from those experiments can help to unravel trends that would have been impossible to observe with classic molecular biology experiments alone.
At PhenoSwitch Bioscience (PSB), we strongly believe that a well conducted proteomics study can give a huge boost to any project involving proteins. This is why we designed our proteomics services to bring a new light to your research project! You see, since it is not directed against a single protein, a proteomic analysis can easily help to uncover a role for several proteins that would not have drawn your attention otherwise. Also, our quantitative proteomics services uses the SWATH acquisition mode to provide quantitative information for every detected peptide in your sample (more information about SWATH here). This means that you can get fold changes between several conditions for thousands of proteins, without having to use cumbersome and expensive labelling protocols! How neat is that!

Typical results from a proteomic analysis
So, what should you expect from a quantitative proteomic study? To answer this question, we designed and conducted a simple experiment using the same settings you would get with our proteomics services. We chose to take a close look at the effects of serum starvation on the proteome of breast cancer cells, since it is a well documented area of biology. To do so, we grew MDA MB 231 cells with or without serum for 24 hours. A third condition (rescue) was also generated by adding back serum to serum starved cells for 1 hour before harvesting. Experiments were performed in triplicate. Cell lysis, peptide generation and sample cleanup were carried out as usual. The data acquired in SWATH mode were mapped on a protein database generated by a 2D LC-MSMS analysis of a pool of proteins from the 3 different conditions. Data acquisition was done on the high speed TripleTOF 5600 from SCIEX, equipped with a micro UHPLC and a standard reversed phase C18 chromatography column. Of note, using our most recent TripleTOF 6600 and an in-depth workflow, we can easily quantify more than 3000 proteins in a single experiment on cell lines.


Now, the interesting part! Serum starvation significantly affected the expression levels of 126 of these proteins. In the rescue condition, a significant difference in the protein levels was found for 97 proteins, when compared with the control condition. Interestingly, as shown in the Venn diagram below, only 42 proteins were differently expressed in both the serum starved and the rescue conditions. A more detailed statistical analysis revealed that for a few very interesting proteins, the differences in expression were only seen in one of the two conditions. For example, the expression levels of the apoptosis regulator BCL2L1 were upregulated in the absence of serum and were completely restored to normal with the serum rescue. If we wouldn’t already know, this would surely lead us to investigate this protein for a role in cell cycle progression and/or apoptosis, wouldn’t it?

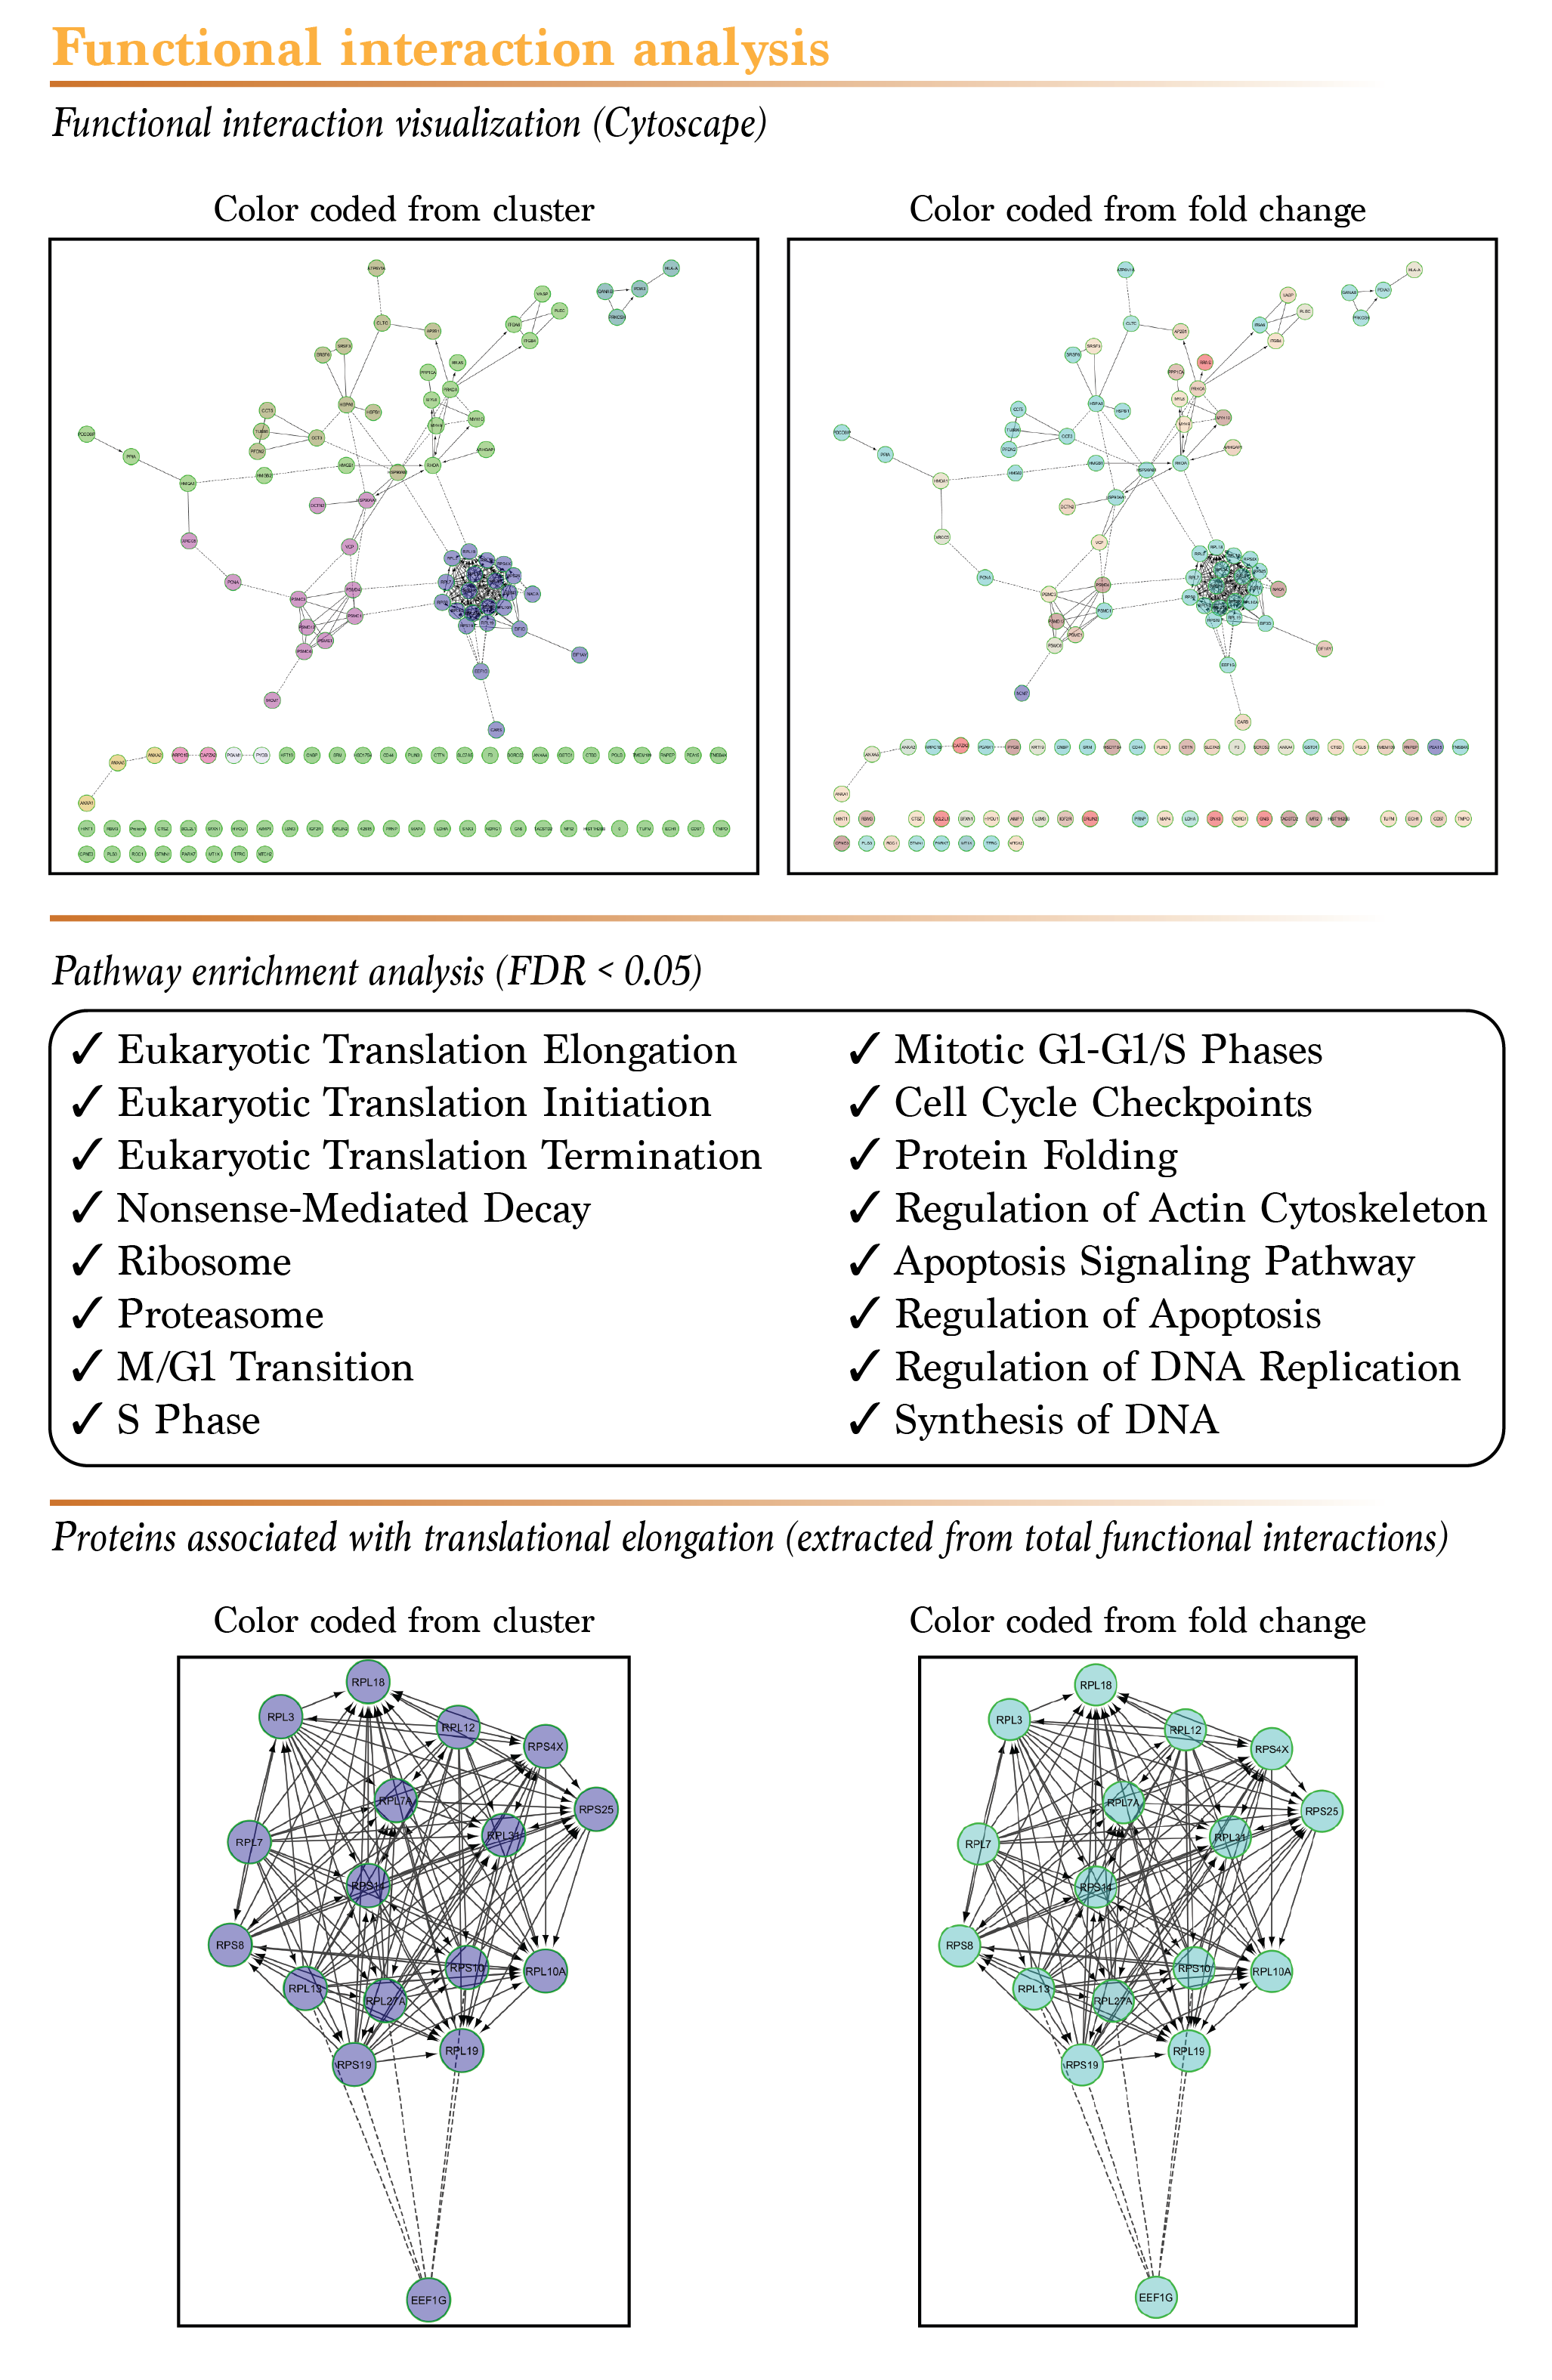
The beauty of all “omics” data relies in the trends it hides. When analysed with the right tools, these data can reveal very interesting results. To better illustrate this, we generated the map of all known functional interactions between the proteins that showed a significant difference in the serum starved condition only using the powerful Cytoscape software. As shown in the figure below, the documented functional interactions between proteins are illustrated by different type of arrows, based on the activating, inhibiting or suspected nature of these interactions. To highlight patterns in the data, we first clustered the proteins in 8 different groups. This led to very clear distinctions between groups of proteins that belong to the same functional group (same colored proteins belong to the same cluster). Next, we changed the color of the proteins according to their calculated fold change, blue being the biggest downregulation and red the highest upregulation after serum depletion. This way of visualizing the data showed that for some cluster, proteins tend to respond to serum depletion in the same way. Since the results of the SWATH acquisition mode are quantitative, these trends should be easily measurable by standard molecular biology techniques, such as Western blots. Finally, we generated a pathway enrichment analysis for all the proteins that showed a significant difference following serum depletion. As expected, the majority of the pathways that were associated with these proteins are linked to cellular proliferation and survival. This confirms that the results you get from our proteomics services with SWATH quantification really reflects what is going on in your cells!

Get clear and meaningful results, every time!
At PhenoSwitch Bioscience, we make everything we can to ensure that you get the most out of your data. This is why our proteomics data report include everything you ask for, such as:
- A complete protocol of the sample preparation;
- A detailed explanation of the calculations;
- A result summary;
- Interactive data visualisation tab;
- Gene ontology (GO) enrichment;
- Functional interactome, with or without clustering and coloring;
- Principal component analysis (PCA);
- Raw data.
Please click on the button below to get the data report that was used to write this post. Don’t hesitate to communicate with us if you have any questions regarding our proteomics services or our other services.